
🥇 Olympic Athlete Weight Prediction
From 120 Years of History to Predictive ML Insights
This Data Science project analyzes over a century of Olympic data to understand athlete physiology and predict their weight categories using Machine Learning.
📊 1. The Story of the Data (EDA)
Before building models, we explored how the Olympics have evolved. The graph below shows the surge in participation over time, clearly highlighting the cancellations during WWI and WWII.

We also identified a strong correlation (0.8) between Height and Weight, which served as the core predictor for our models.

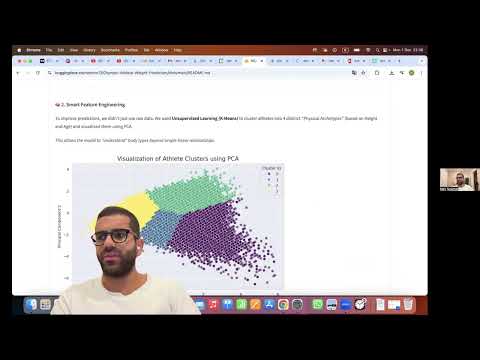
🧠 2. Smart Feature Engineering
To improve predictions, we didn't just use raw data. We used Unsupervised Learning (K-Means) to cluster athletes into 4 distinct "Physical Archetypes" (based on Height and Age) and visualized them using PCA.
This allows the model to "understand" body types beyond simple linear relationships.

🎯 3. Regression Results (Predicting Exact Weight)
We trained three models to predict weight in kg. The Random Forest Regressor was the clear winner, outperforming linear models by capturing non-linear patterns in different sports.
- Winner: Random Forest
- R2 Score: ~0.71

⚖️ 4. Classification Results (Predicting Weight Class)
We converted the problem into a classification task (Low / Medium / High weight). The Random Forest Classifier achieved the best accuracy, successfully distinguishing between classes.
- Accuracy: ~74.4%
- Precision Focus: We prioritized precision to minimize "False Positives" in potential scouting scenarios.

🎁 Bonus: 3D Visualization
Using Plotly, we mapped the decision boundaries in 3D space (Height vs. Age vs. Weight), confirming the complexity of the data structure.

📂 Project Files
Student_Notebook.ipynb- The complete Python code.random_forest_regressor.pkl- Trained Regression Model.random_forest_classifier.pkl- Trained Classification Model.
Created for the Data Science Course, 2025.
- Downloads last month
- -